Data Analytics and Visualization
Overview of Floyd|Snider Contributions

Master Plan Influent Data Characterization. Floyd|Snider evaluated the concentration and the distribution of pollutants in stormwater influent as part of its engineering analysis. Learn more about how the team supported installation of stormwater treatment systems at Terminal 18 in Seattle.
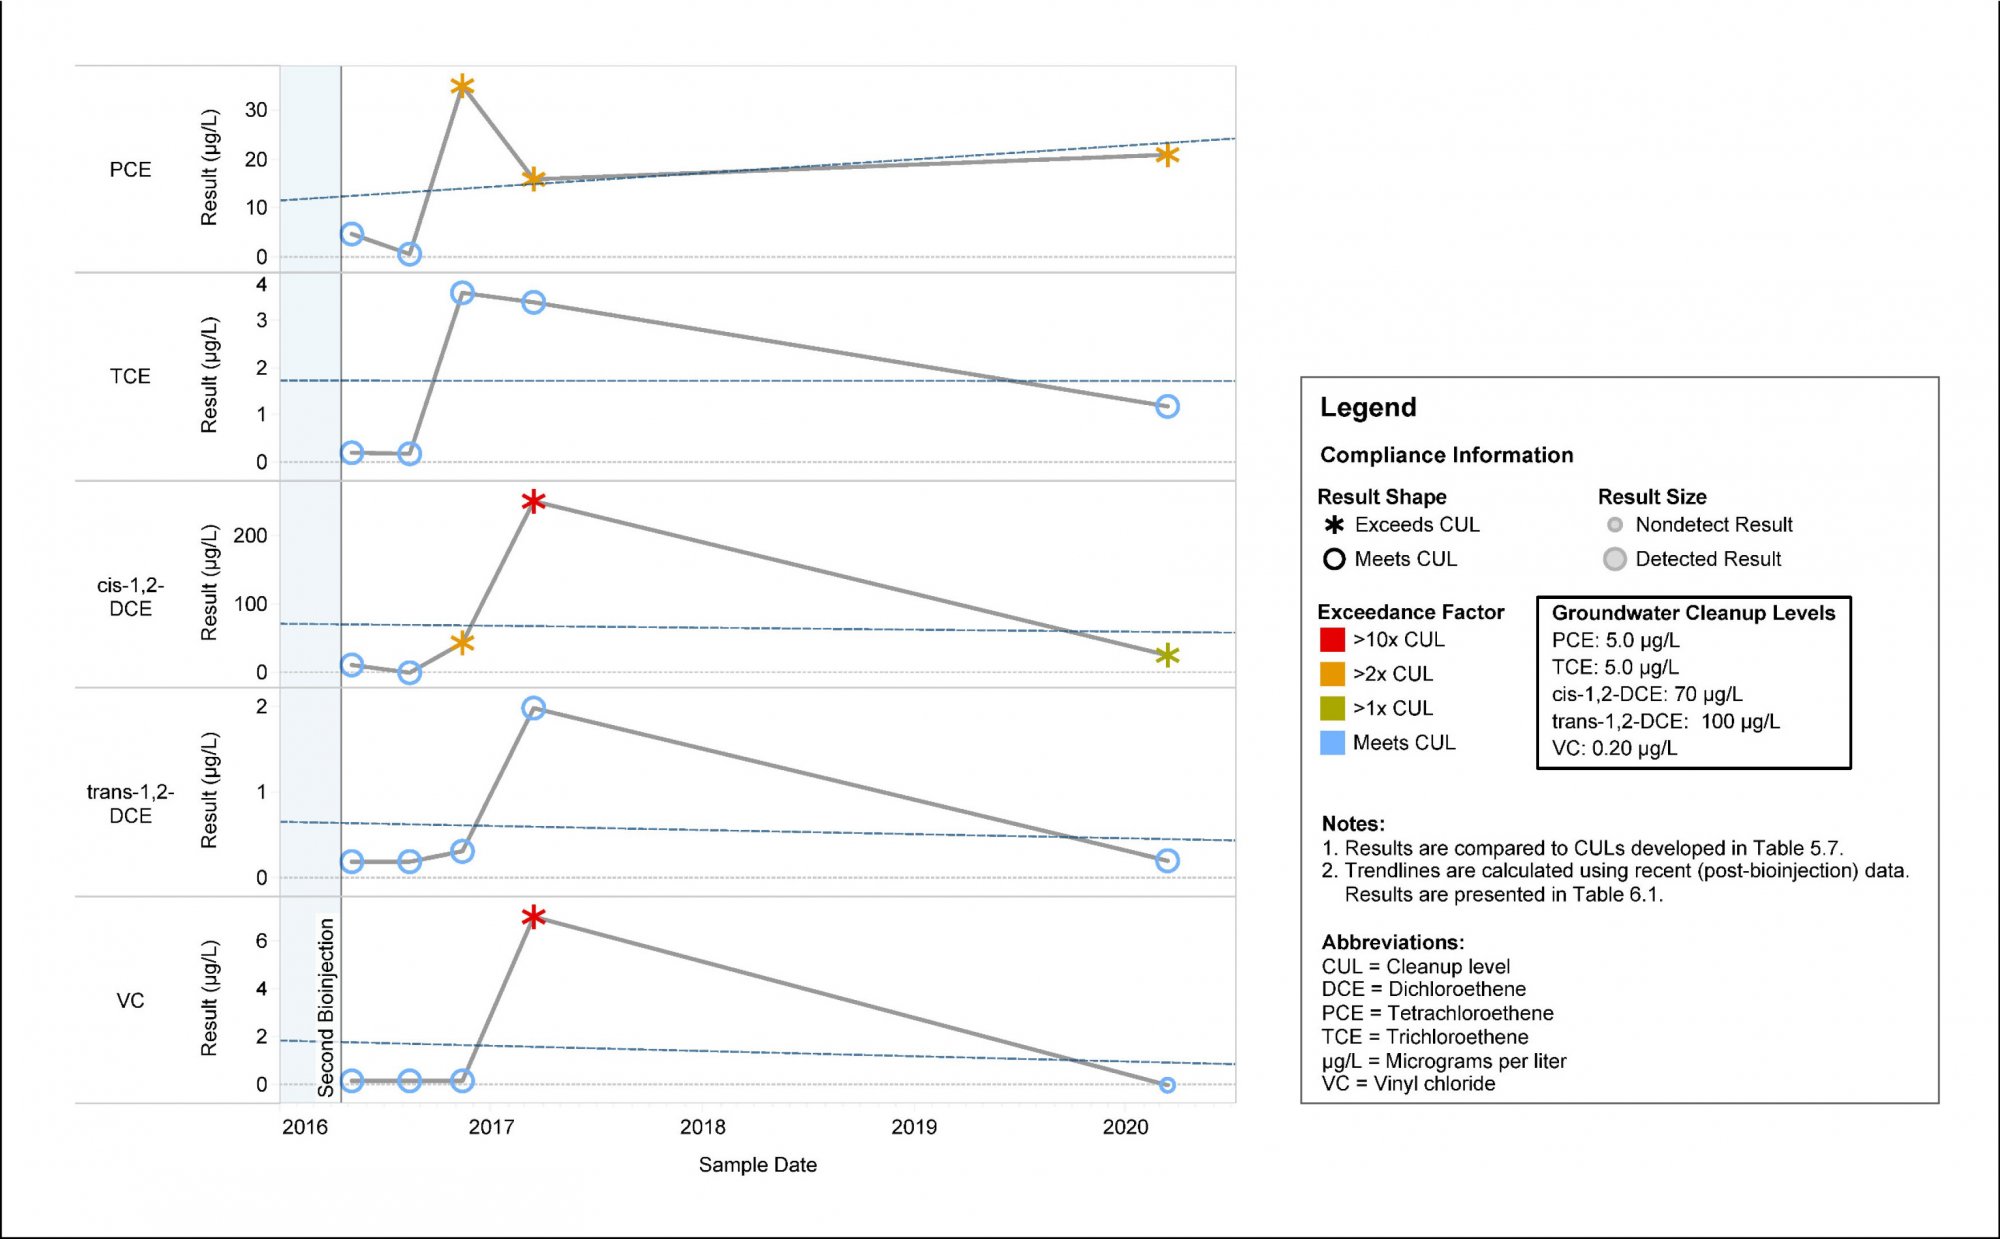
cVOC Time Series Chart. Floyd|Snider performed a data gaps evaluation at a site where several prior interim measures had been completed by a prior consultant. Floyd|Snider’s evaluation revealed several wells had an increasing tetrachloroethene (PCE) trend, indicating additional source mass remained onsite. Learn more about our work on City of Bothell projects.

Total Molar Concentration and Percent Composition Chart. Floyd|Snider assumed management responsibility for an existing chlorinated solvent treatment system in late 2023. Data analysis revealed that low total organic carbon (TOC) levels were reducing system performance. After Floyd|Snider modified the system, it achieved a threefold reduction in chlorinated solvent concentrations. Learn more about our work on City of Bothell projects.
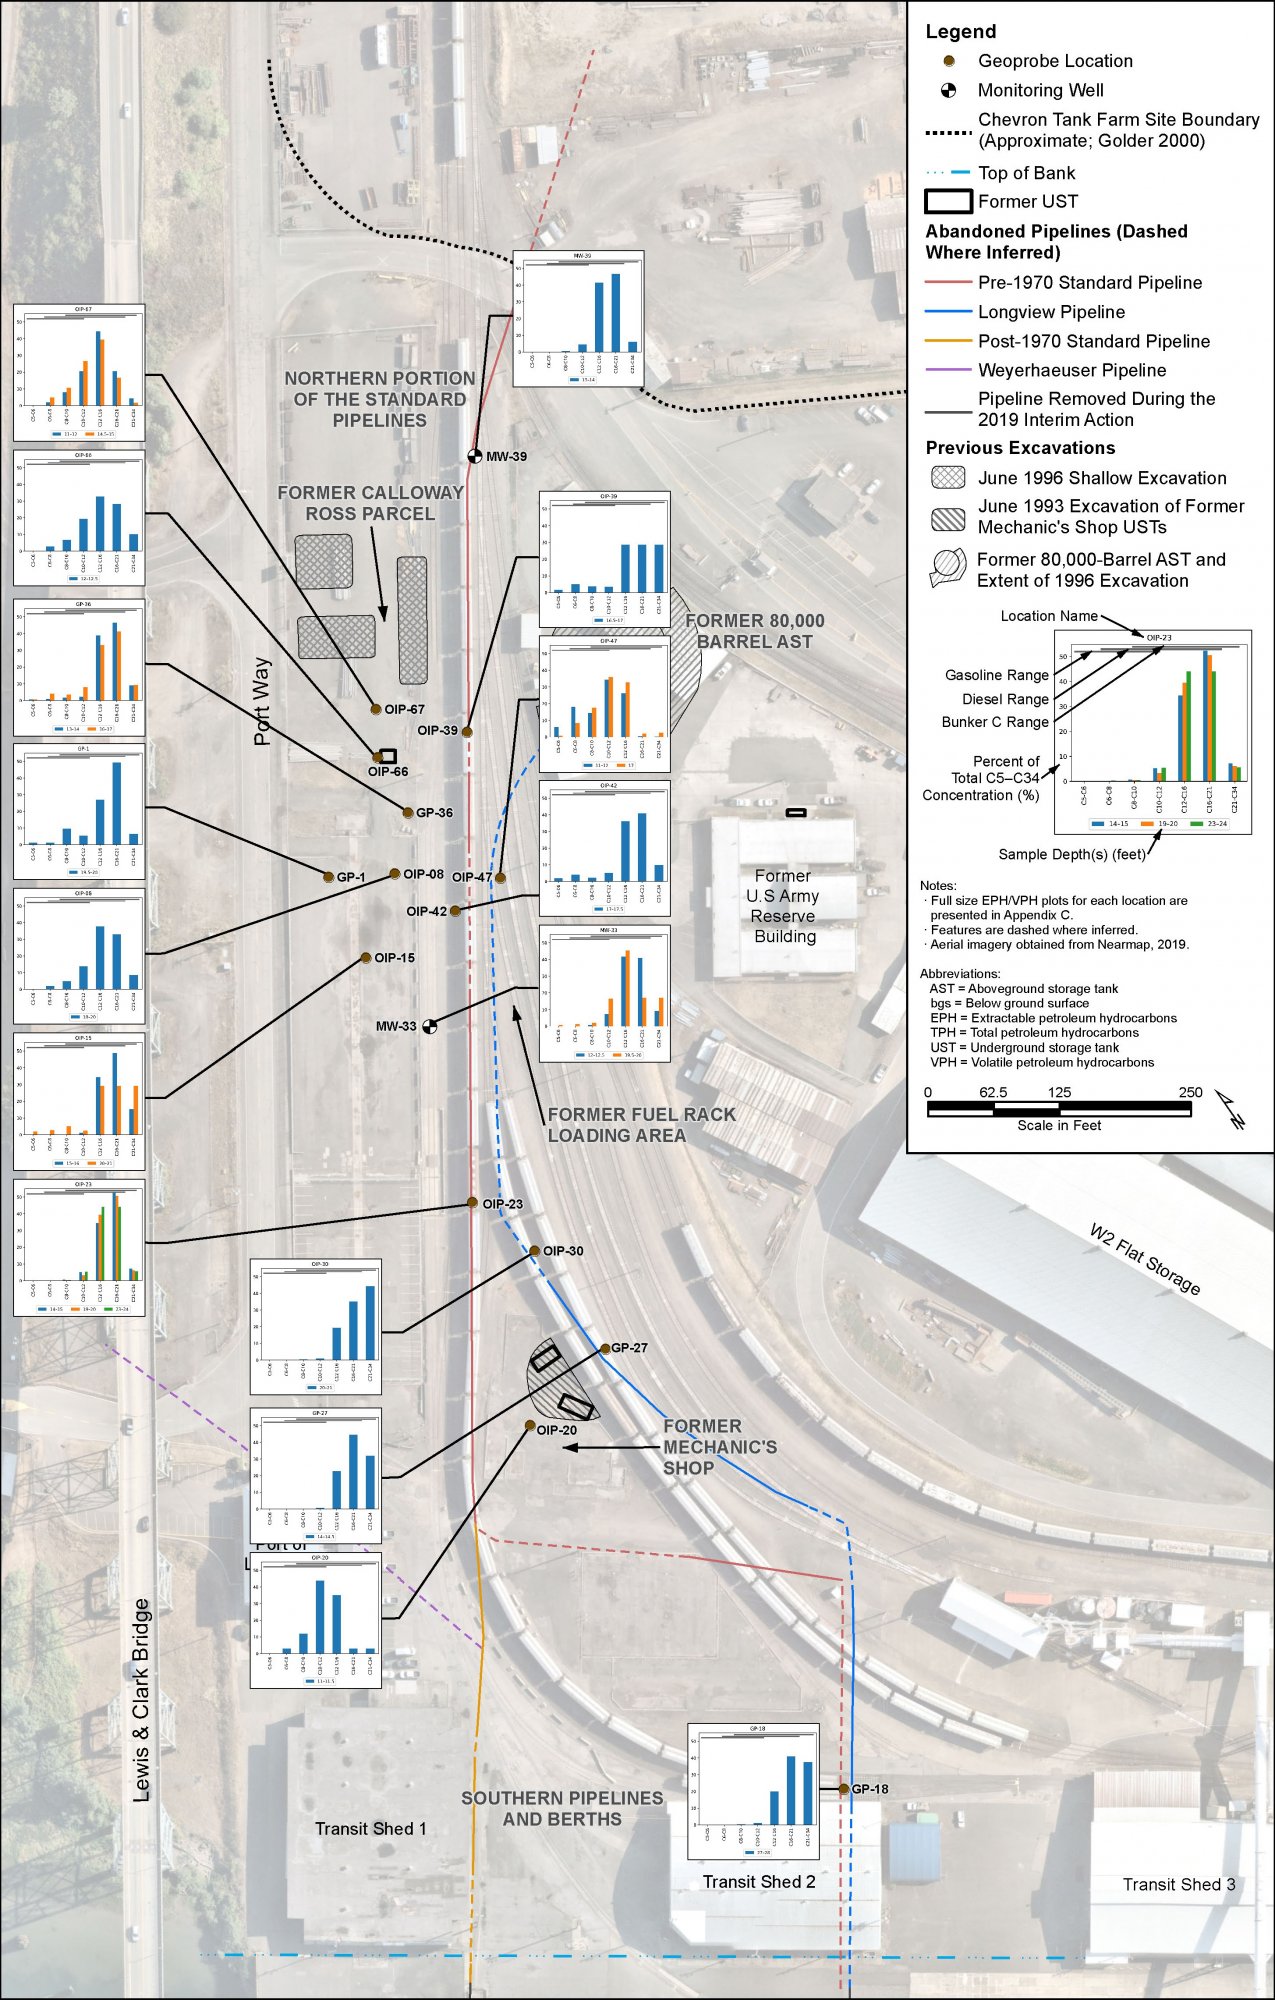
Soil EPH VPH Results. Floyd|Snider’s experience presenting and interpreting environmental data has been used to identify unique releases at cleanup sites with multiple operations. At the Port of Longview, Floyd|Snider’s total petroleum hydrocarbon fractionation mapping supported the identification of several distinct petroleum releases.
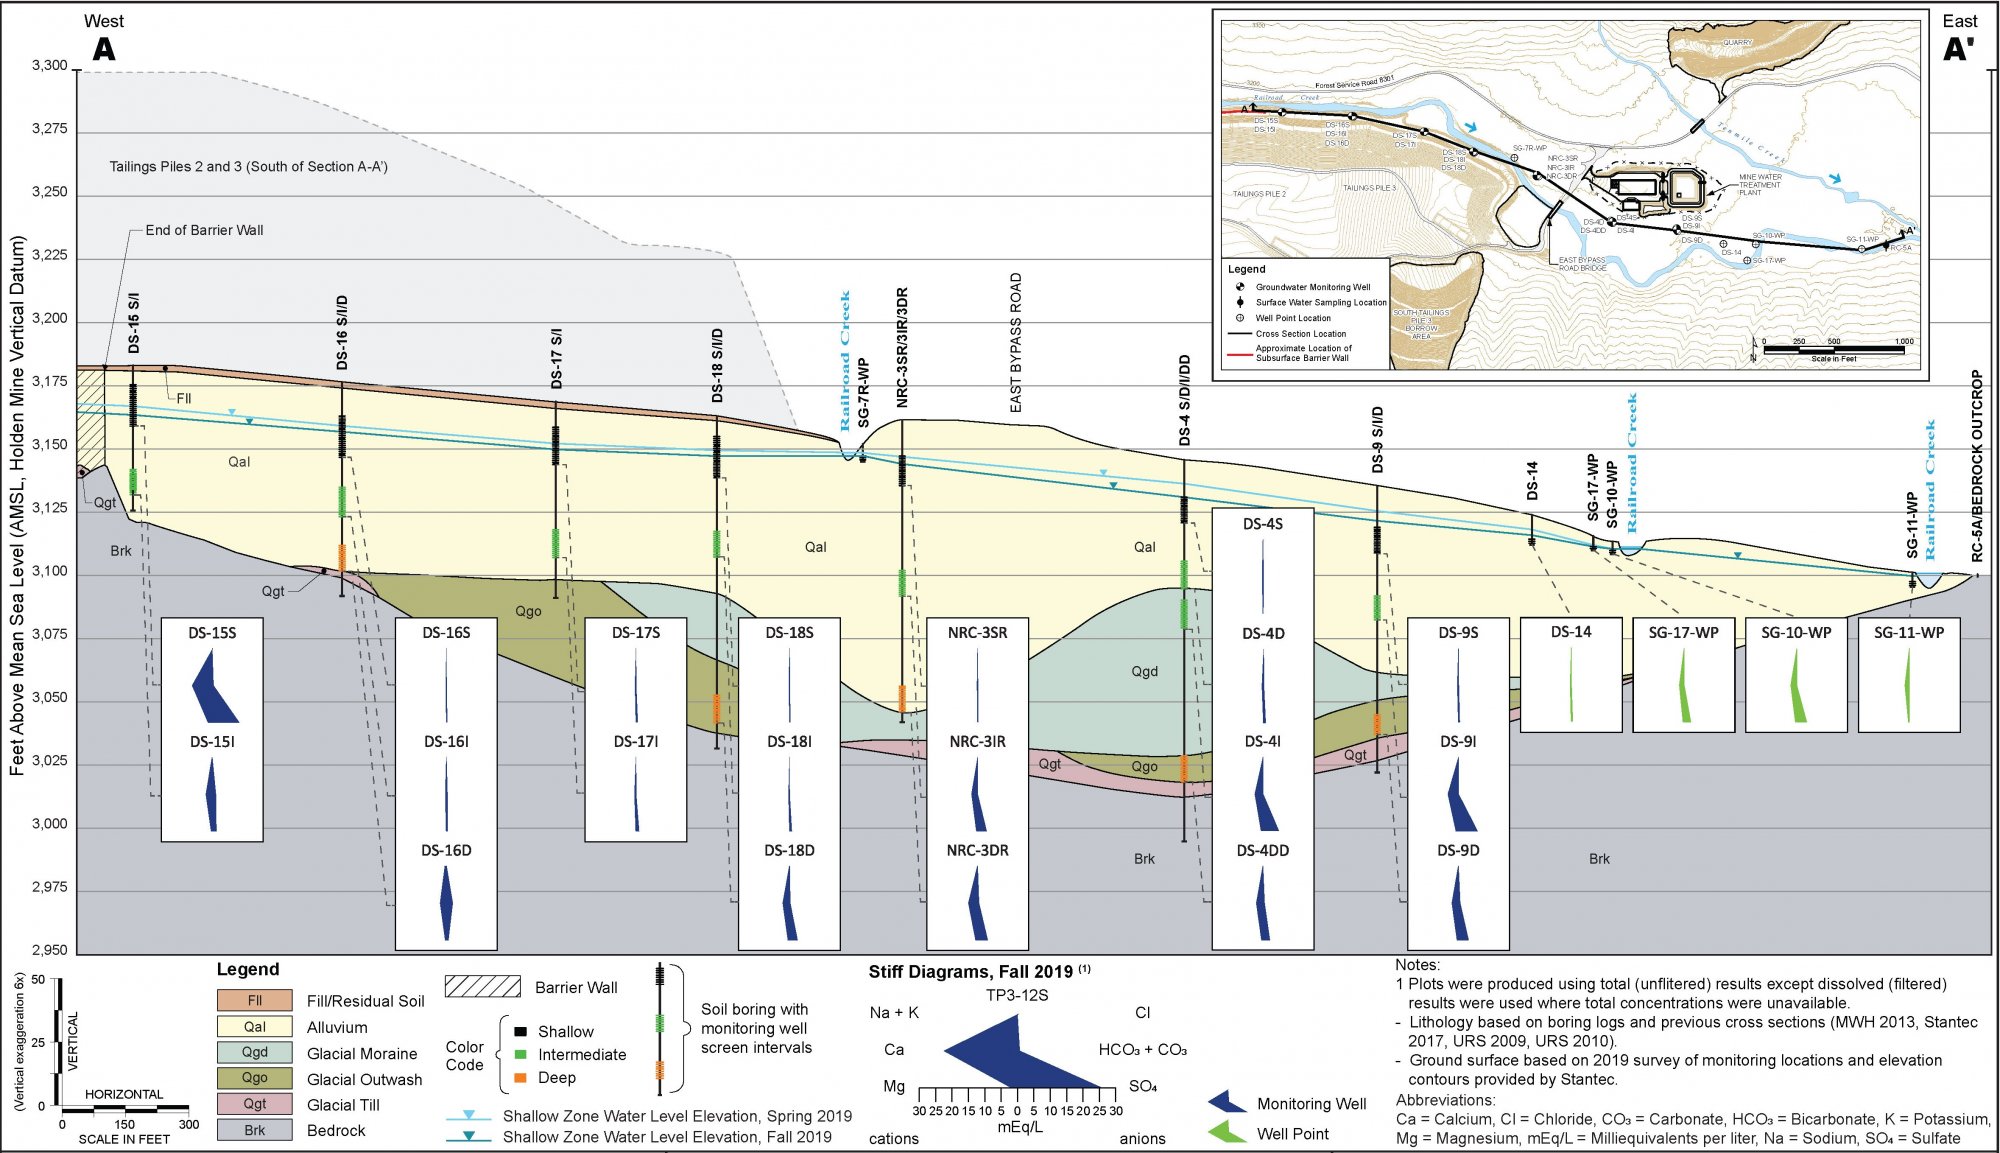
Annual Compliance Assessment Report Generalized Cross Section with Stiff Diagrams. The Floyd|Snider team interpreted data along generalized cross sections from three monitoring seasons based on two lines of evidence: the direction and potential for groundwater movement through deep, intermediate, and shallow well completions and lithologic observations from review of existing well logs. Learn more about how the Floyd|Snider team’s approach to data collection and evaluation supports remediation of the Holden Mine Site.

Total PCBs and PeCDD Investigation Results with Sediment Core Diagrams. The Floyd|Snider team supports Radius Recycling in remediation of the River Mile 3.5 East Project Area within the Portland Harbor Superfund Site. Floyd|Snider’s data rich and intuitive graphics enhance understanding of sediment conditions within the Project Area and are used to inform remedial design.
Our Approach
Statistical analysis of complex datasets and visual presentation of interrelated data provide valuable insight to the project approach and result in successful outcomes at even the most challenging sites.
Our Approach
Floyd|Snider’s team of data analysts, chemists, and technical staff adopts a collaborative approach to transform complex data into visually compelling and informative charts, graphs, plots, and infographics. Statistical analysis of complex datasets and visual presentation of interrelated data provide valuable insight to the project approach and result in successful outcomes at even the most challenging sites.

PM10 Normalized to Wind Data. As part of a broader source control approach for a client that operates a waterfront facility, Floyd|Snider collected and evaluated particulate data to better understand whether air deposition could represent an ongoing source of contamination to sediment.
Tools and Software
ArcGIS Pro and ArcGIS Online
Tableau
R and Python
ProUCL
Excel VBA